

Stock market enthusiasm continues in 2026
Stock markets have been soaring to new highs for years, even amid a complex geopolitical climate that might otherwise deter investors. Several factors explain this phenomenon.

Key trends
- Stock markets are drawing increasingly younger investors, driven by more accessible financial products such as ETFs.
- Since the 2008 financial crisis, central banks have pumped vast liquidity into markets, further boosting equity investments.
- Massive investments in AI and strong corporate earnings are powering stock index performance.
Stock investments more accessible than ever
AI’s influence on recent market performance is frequently highlighted. While corporate results remain overwhelmingly positive across many sectors, others face undeniable challenges that cannot be overlooked.
Investing in the stock market now seems effortless, drawing in growing numbers of participants. The rise of ETFs (trackers) is clearly a driving force. A recent survey revealed that individuals aged 35 (or younger) rely more on stock market gains for wealth accumulation than on salary growth. This is a striking shift worth thinking about.
How to explain market optimism?
A closer look reveals that since the 2008 financial crisis, central banks worldwide have injected massive liquidity into the economy by financing public debt through large-scale government bond purchases, as well as by acquiring other financial assets held by banks. This included post-2008 securitised products, for instance.
In Europe, the European Central Bank’s balance sheet expanded ninefold between 2008 and 2022. This is a trend mirrored in the US and Japan. One could argue that with such abundant liquidity, the money must flow somewhere. This logic isn’t entirely unfounded.
Equities account for 50% of global investments
The chart below shows the percentage breakdown of global financial assets since 1950 - data that isn’t readily available, making it particularly relevant today. It highlights the growing appeal of equity investments (including private equity) since 2010. Currently, roughly 50% of all global financial assets are allocated to equities (public and private). For comparison, this share stood closer to 30% just after the 2008 financial crisis, while in 2000, before the dot-com crash, it neared 60%.
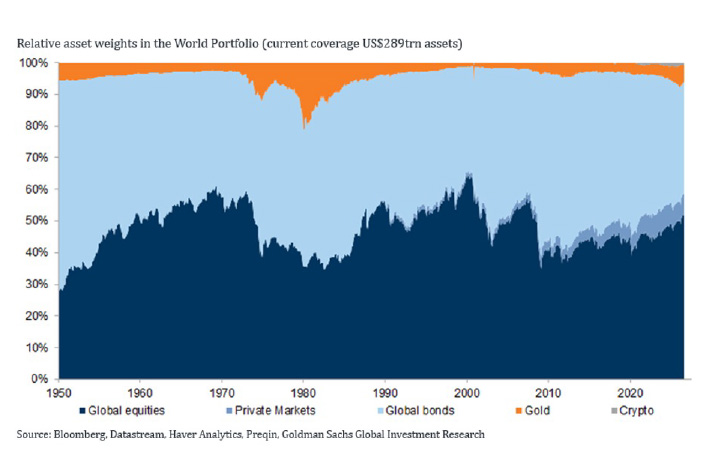
These figures also illustrate the declining interest in bond investments, which naturally developed as interest rates plummeted after the 2008 crisis. It’s important to remember that this drop in rates was a direct result of central banks’ policy decisions at the time. The sharp rise in long-term interest rates since the Ukraine conflict does not appear to have fundamentally altered the outlook. This is likely because real long-term yields - once inflation is accounted for - remain too low to attract investors on a large scale.
Gold and cryptocurrency
The chart also highlights the significance of gold in portfolios, as well as the negligible role played by so-called ‘crypto’ currencies, despite the outsized attention they briefly received in the recent past.
This article does not aim to advise whether to invest in equities or not. Instead, its purpose is to gauge the scale of the recent surge in risk capital (public and private) that is widely discussed but rarely quantified. It also shows that today’s asset allocation is not unprecedented: there have been periods when equity investments held an even larger share than now, and others when gold saw even greater demand than in recent years.
Understanding these magnitudes is often insightful, even if history rarely repeats itself.