Income inequality in Belgium: facts and perceptions
5 min
Recent work by the NBB suggests that income inequality in Belgium may be higher than previously thought. Nevertheless, it remains low compared to the rest of the EU and, equally important, stable. Seventy per cent of Belgians would like to see it fall further, even though their political preferences may be influenced by misinformed beliefs.

"All happy families are alike; each unhappy family is unhappy in its own way."
Leo Tolstoy, Anna Karenina
And some families earn more than others. While the Belgium economy may not be renowned for many positives, strong income-redistribution is one of them. Recent work by the NBB challenges the existing methodology for measuring household income inequality. The conclusion is that inequality may be higher than previously thought, but it remains low and stable. However, this does not seem to hold much sway over the general population or their voting behaviour.
Gini coefficients
Income inequality is typically expressed using the Gini coefficient. This approach ranks all households from lowest to highest income and calculates what share of total income each group receives. A perfect equal distribution would resemble the straight black line in the graph below.
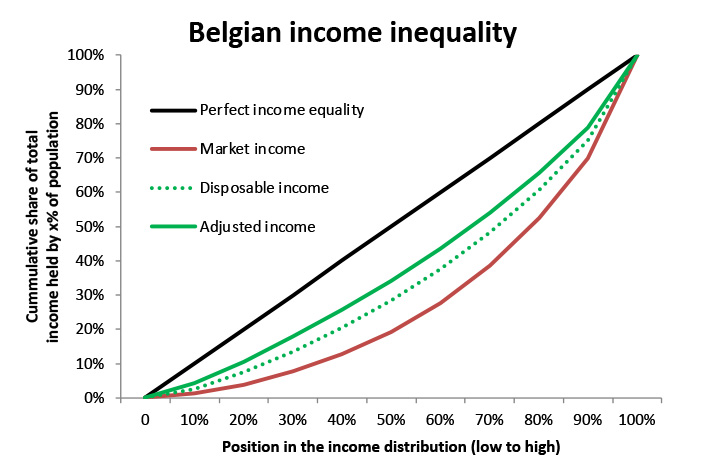
This is not a likely outcome in a Western, market-driven economy. Instead, we get something like the red line, which shows the cumulative income distribution for market income. This shows that the lowest income decile represents just 1.2% of total income, whereas the highest share is 29.9%. Consider these figures to represent gross incomes.
The various taxation- and social-welfare schemes in our country push the red line to the full green line of “adjusted income”. The net incomes on this line are significantly more equal. The lowest decile ends up with 4.2%, the highest with 21.2%.
Economists like to capture the whole graph in a single number. This is the Gini coefficient. It measures the surface area between the actual distribution and the perfect (black) one, ranging between an ideal “0” and a dystopian “1”. In Belgium the market income inequality comes in at 43. After government intervention this figure falls to 23. This makes Belgium one of the most income-equal countries in the EU.
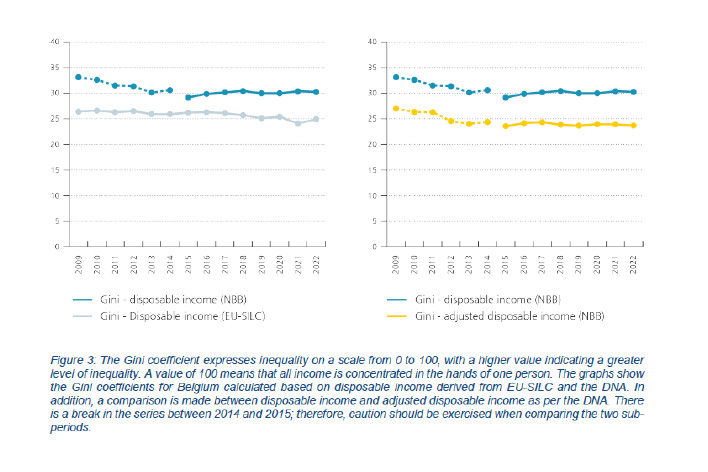
This is not a new phenomenon. Both the classical (EU-SILC-data-based) and the new NBB methodology show a mostly stable Gini coefficient since 2015.
The National Bank Economists have responded to a growing demand for indicators relating to household well-being and prosperity. According to them, these serve as useful tools for developing targeted economic policies and analysing the impact of exogenous shocks on different groups of households. This is important information for policymakers. This raises the question: what is the policy response to fluctuations in income inequality?
What drives redistribution preferences?
Vladimir Gimpelson and Daniel Treisman recently revised their 2015 paper “Misperceiving Inequality”.
In democracies, they state that the majority of the poor can vote to tax the rich. Consequently, higher inequality is thought to produce more generous social spending. This seems like common sense, but what if most citizens do not know whether they are relatively rich or poor?
Gimpelson and Treisman provide evidence that such uncertainty and misperception are extremely widespread. Results from nine large, cross-national surveys suggest that, in recent years, ordinary people had little knowledge of the extent of income inequality in their societies, its rate of change and direction, and their position within the distribution.
Often, what they think they know is incorrect.
When asked about the current level of, and recent trends in, inequality in their country, respondents performed only slightly better than would be expected by chance. Many could not even make a rough estimate of the average wage nationwide, the average salary for different jobs, the wealth share of the top one per cent, or the current poverty rate. Those who were almost certainly near the top of the distribution thought they were near the bottom, and vice versa.
The following anecdote from their papers drives home their point:
Owning two houses is usually a sign of wealth. In all 40 LiTS countries, no more than one in four respondents said that their family owned a second residence, and in all but three countries, this figure was less than one in six. Yet most property owners did not consider themselves to be particularly wealthy. On average, 60 per cent of secondary residence owners placed themselves in the bottom half of the income distribution. In Uzbekistan, for example, only 3% of respondents lived in households with a second residence, yet almost two-thirds of these individuals believed that their income was below the national median. Such anomalies were somewhat rarer in developed countries. Nevertheless, in France, Italy and Great Britain, 40 per cent or more of secondary residence owners placed themselves in the bottom half of the income distribution in their country.
While actual inequality, as captured by the best current estimates, is not related to preferences for redistribution, Gimpelson and Treisman demonstrate that perceived inequality is. They argue that, both within and across countries, perceptions of inequality closely track demand for government redistribution, while the relationship with actual inequality is tenuous at best.
Belgian voters
It is time to test this theory. Is perceived inequality really a stronger driver of redistribution preference than actual inequality? Or, put another way: despite low and stable income inequality, are Belgians still demanding greater efforts from their government? The 2022 Eurobarometer sheds some light on this.
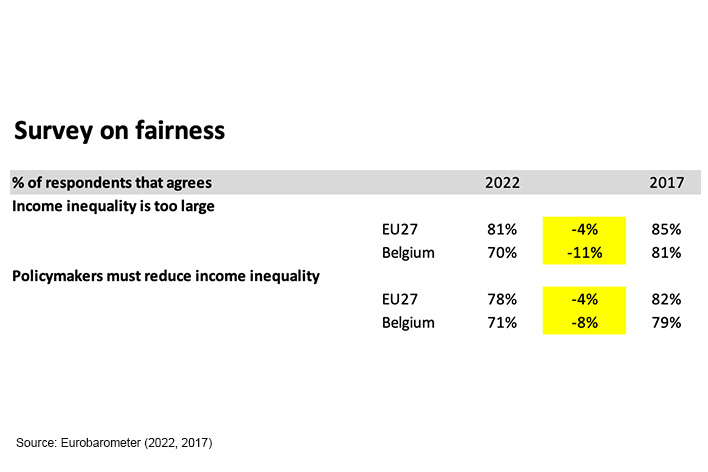
70% of Belgians consider income inequality to be too high. This is lower than the EU27 average of 81%, which has a higher level of inequality. More interesting is the evolution. Despite the Gini coefficient remaining flat, 11% of Belgian respondents have changed their mind about it being too elevated. But what about actual redistribution preferences? These have also declined, from 79% to 71%.
Gimpelson and Treisman might argue that perceived inequality and redistribution preferences have declined in parallel, thus indicating their hypothesis. This could be interesting news for the cash-strapped De Wever government, who might now ask: what it would cost to further reduce the perception of income inequality.