

Climate transition part 1: the price of climate (in)action
Climate policy is often sold as a moral choice. Economists know better: it’s primarily a question of price. How much does a tonne of CO2 have to cost to really change behaviour and reduce CO2 emissions? Who will foot the bill if we leave that question unanswered for too long? Figures from the Oxford Economics think tank provide a clear answer: postponing is the most expensive option on the menu, not the cheapest.
Things to remember:
- A climate transition that succeeds in stabilising temperatures will be felt in our wallets.
- Innovation leads to productivity gains and sustainable higher growth.
- If policy remains unchanged with minimal investment, physical risks will increase.
- The annual number of heatwave days in Belgium will increase from 4 to 18 by 2050.
- A rapid climate transition is the cheapest.
What happens to the economy as the carbon price rises?
Let’s first look at the carbon price itself. The consensus assumes a minimum global carbon price of 50 to 100 dollars per tonne - today (!) - to stand any chance of a successful transition towards net zero by 2050. This price will rise significantly after 2030, to between $400 and even $900 per tonne by 2060, depending on the transition scenario chosen by Oxford Economics. Compare that with the base case scenario, where the current carbon price is climbing from $7 per tonne to barely $40, to stay there. A genuine climate transition in which we manage to stabilise the temperature to some extent will be felt in our wallets. Don’t let anyone tell you otherwise.
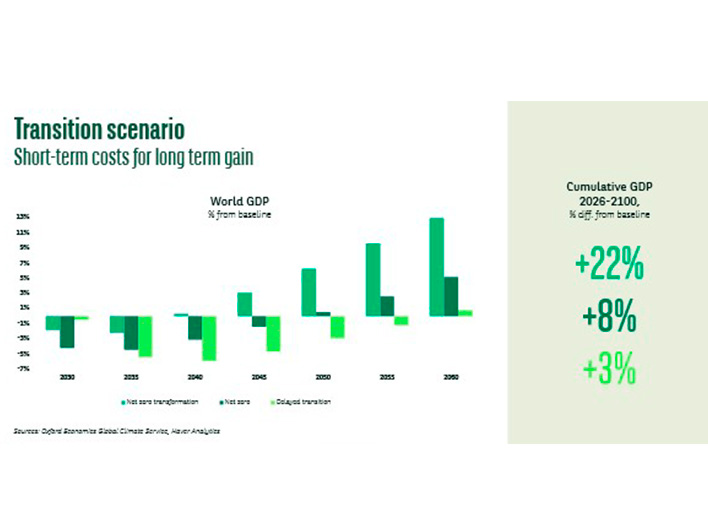
What happens to the economy as the carbon price rises? The higher prices of carbon-intensive products are driving inflation, which eats into real income. In the graph, this translates into an increased climate risk.
Net Zero scenario
In the Net Zero scenario, global GDP therefore initially falls below the baseline scenario, just as in the Net Zero Transformation and Delayed Transition scenarios (all three curves in the chart dip before 2040). As the economy restructures, moving away from taxed fossil fuels, and temperatures cease to rise further; the tide turns. By 2060, the Net Zero Transformation scenario is even 12% cumulatively above the baseline scenario, followed by Net Zero by 4% and the slower Delayed Transition by 3%. By 2100, these differences will rise to 22%, 8% and 3% respectively.
Net Zero Transformation scenario
The positive outcome in Net Zero Transformation is mainly due to innovation-driven revenues, not to the carbon price itself. On the contrary: substantial investment in low-carbon technologies ensures that the carbon price only needs to be raised to half the level required in the Net Zero scenario. Innovation leads to productivity gains and sustainable higher growth. It’s a bit like exercising: your muscles ache for the first few weeks, but those who persevere (and don’t overdo it) gain fitness that more than compensates for the initial cost.
Delayed Transition scenario
In the Delayed Transition scenario, we are delaying too long with increasing current carbon prices. This ultimately requires a much more abrupt price rise and a more persistent inflation spike than the gradual paths. Temperatures will also rise slightly higher – by +1.7° Celsius by 2060 (compared to the pre-industrial era) – than the +1.6° Celsius in both Net Zero scenarios. The curve for Delayed Transition remains below the baseline scenario (zero on the graph) for longer than the other two, before eventually – albeit only marginally – rising above it.
Physical risk
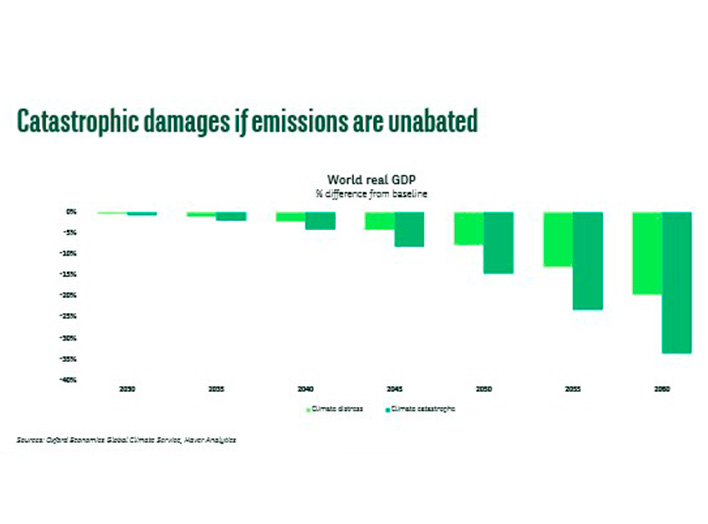
The most sobering picture remains that of an unchanged policy with minimal investment. Physical risks increase in all three scenarios: the baseline, ‘Climate Distress’ and ‘Climate Catastrophe’. In the latter catastrophe scenario, global warming will reach 2.7°C by 2060. Rising global carbon emissions push temperatures further into an upward spiral towards a 4.4°C increase by 2100.
More extreme weather events
These rising temperatures lead to more extreme weather events. According to the Flemish Environmental Society, the annual number of heatwave days in Belgium will increase from 4 (average from 2000 to 2019) to 18 by 2050. And by 2100, this could reach 50 days per year. Heatwaves also reduce labour productivity. The graph shows global GDP that could be between 35% below the baseline scenario by 2060. Annual growth will turn negative from 2041 onwards.
Acting quickly is the cheapest option
Taken together, these figures tell a simple story: a rapid climate transition is the cheapest option. During the transition, higher prices will temporarily put pressure on our purchasing power, but in so doing we will avoid the much far more costly physical and irreversible damage caused by a further warming planet. Delaying action will not result in a cheaper bill, only a later and steeper one. Or as an accountant might put it: interest on unpaid debts does not stop accruing just because you don't open the letter.