

Stock market bubble: is history repeating itself?
From Dutch tulip mania to Japan’s market bubble, history illustrates the risks of high market concentration, as well as those surrounding today’s hype about artificial intelligence.

Key takeaways
- The Democrats’ victory revived investors’ concerns about AI
- US equity portfolios are highly concentrated
- History shows that even promising companies can sometimes crash
- Today’s market concentration calls for vigilance
Does AI show the signs of a bubble?
The stock market is sensitive to sudden mood swings. Periods of euphoria sometimes end when underlying concerns resurface. This happened recently following the blue wave in the US midterm elections.
The Democrats’ victory was seen as the end of the gold rush promised by AI companies. As a result, stock markets fell briefly but sharply.
Artificial intelligence will not, of course, disappear overnight. But the reality check following the Democrats’ victory should make us think about a potential AI bubble.
Lessons from the great bubbles of the past
Long-term statistics on bubbles are scarce. Some stories are well known, such as the dot-com bubble or tulip mania in the Netherlands. The latter burst in 1637 after 3 years of unrestrained speculation. It is often considered one of the first major speculative bubbles.
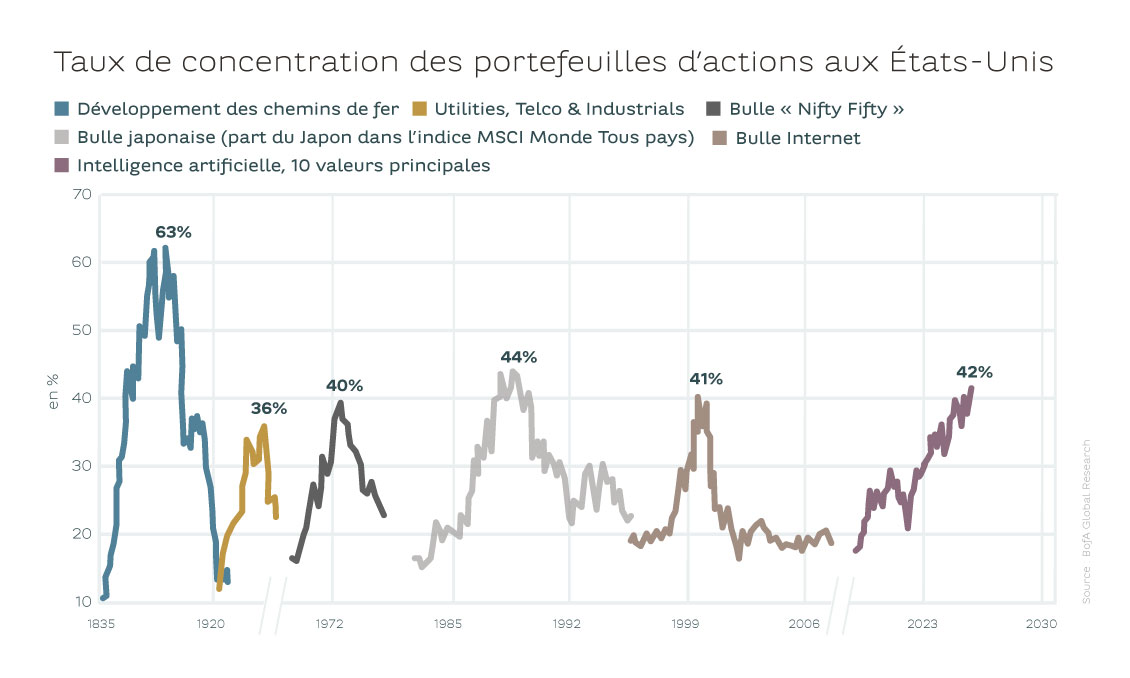
Bank of America’s chart is particularly revealing in this respect. It shows the peaks in concentration during the various major stock market bubbles since 1835. With the exception of the railway bubble, most bubbles burst after concentration reached around 40%. This is close to the current level for AI.
Pourquoi et comment les bulles spéculatives éclatent-elles ?
Stock market history offers 3 striking examples.
- The Utilities, Telco & Industrials crisis refers to the difficulties faced by utility companies (electricity, gas and water), telecommunications companies and heavy industry at the start of the Great Depression. In the 1920s, electricity companies grew rapidly. Many were financed through complex holding structures and debt. Falling demand and financial difficulties after the 1929 crash put these companies under such pressure that their share prices collapsed. This period shows that even healthy sectors can sometimes suffer sharp corrections.
- The Japanese bubble of 1990 involved the collapse in property prices. This followed a period of euphoria in which Japanese banks granted excessive loans for land and stock purchases. Rising property prices served as collateral for new lending, which in turn fuelled speculation. When Japan’s central bank began raising interest rates in 1989, investors started selling their assets. This led to a crash.
- The so-called ‘Nifty Fifty’ bubble was a period of unprecedented speculation in the United States. It is particularly interesting because it involved high-quality companies such as Coca-Cola, IBM, McDonald’s, Johnson & Johnson and Xerox. These companies generated strong profits and held dominant positions in promising markets. In 1973, the first oil crisis, a wave of inflation and rising interest rates sent share valuations and economic prospects plummeting. Investors sold in droves, causing share prices to tumble.
Does excessive concentration always lead to a crash?
The chart shows that portfolio concentration above 40% generally marked a turning point in the major bubbles of the past.
No one has a crystal ball. But the chart helps us take a step back. It reminds us that growth cannot continue indefinitely. In the past, the tide often turned once concentration exceeded a certain threshold. This happened for various reasons, such as rising interest rates or an economic slowdown. It remains to be seen what the future holds for today’s much-discussed AI boom.
No one has a crystal ball. But the chart helps us take a step back. It reminds us that growth cannot continue indefinitely.